Supplementary Figures
Figure W1: Viral community characteristics at each station.

A/ Viral concentration and the ratio of viruses to bacteria (NA; not available). B/ Relative abundance of viral taxa based on virome annotations. C/ Relative abundance of viral morphotypes based on qTEM. D/ Box plots of viral capsid diameters. E/ Correspondence analysis comparing viral communities based on capsid diameter distributions (the inertia explained by CA1 and CA2 is reported in parentheses on each axis).
Figure W2: Schematic representation of barcode and sub-OTU richness shared between samples.
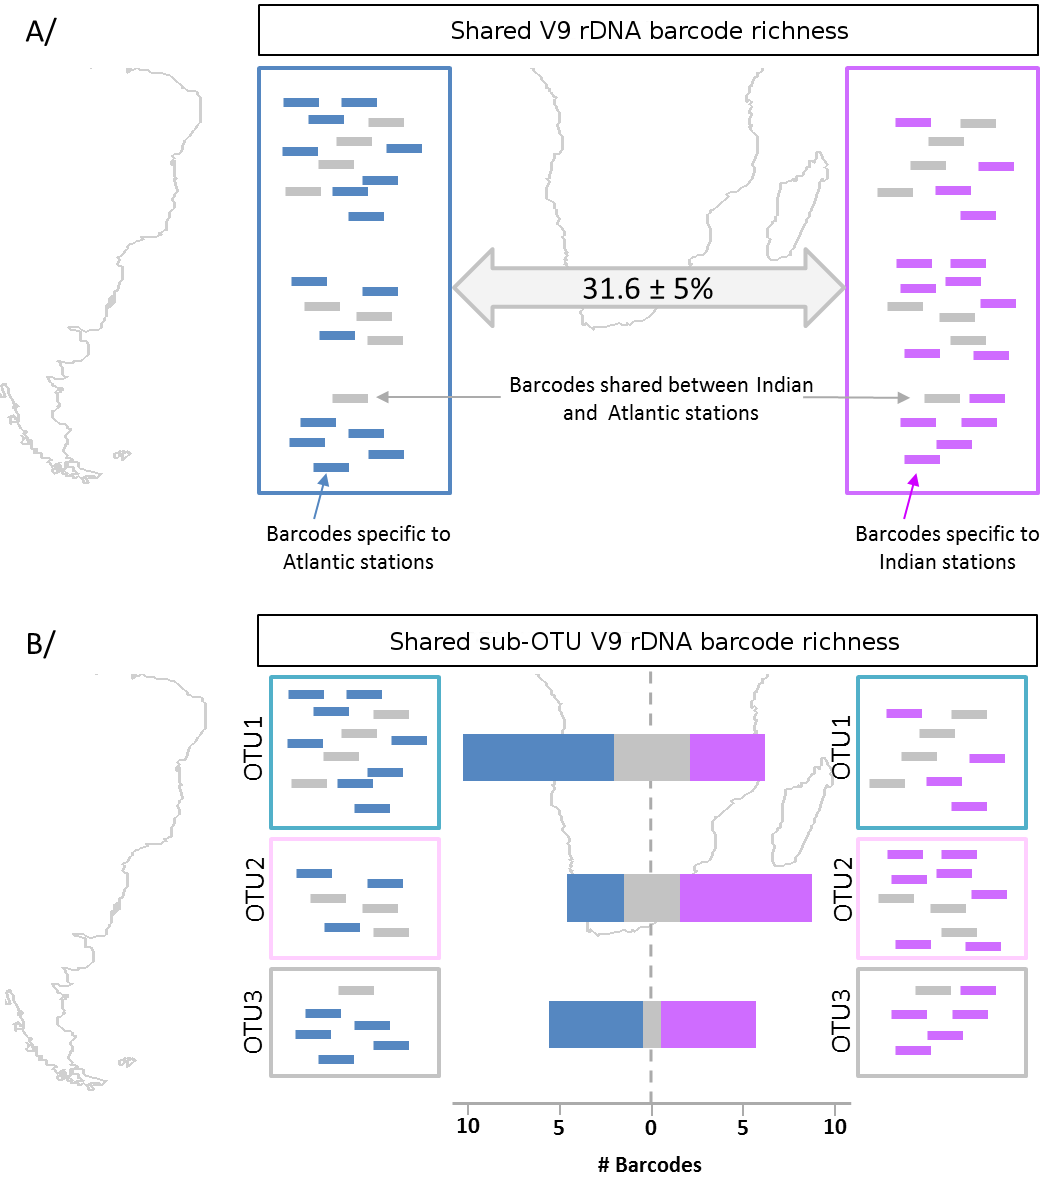
A/ Shared barcode richness is the proportion of 100% identical V9 rDNA barcodes between two samples. The blue and pink boxes represent an Atlantic and an IO sample, respectively. Inside each sample the horizontal lines represent sequenced V9 rDNA barcodes, with grey barcodes being common to each sample, while blue and pink barcodes are specific, respectively, to the SAO or to the IO samples. B/ The shared sub-OTU richness considers the same V9 rDNA barcodes grouped by OTU clusters. Here, three distinct OTUs are represented, with the same barcode color coding as in A (grey for barcodes in common, colored for barcodes specific to each sample). For each OTU, the number of barcodes in common or specific to each sample are represented as barplots, the blue, grey and pink color segments of an OTU bar are proportional, respectively, to the number of sub-OTU barcodes unique to the SAO sample, common to both samples, or unique to the IO sample.
Figure W3: Metagenomic reads in common between samples.
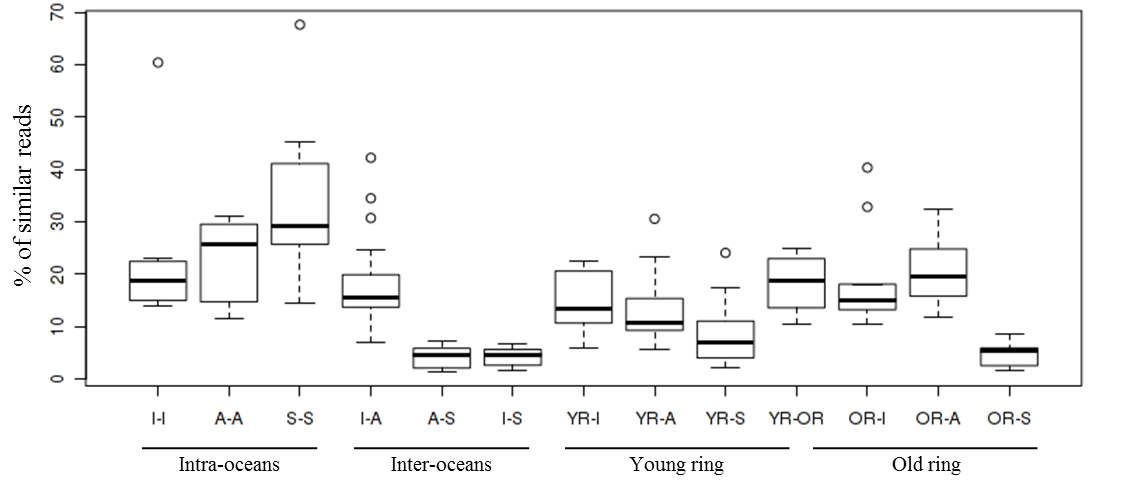
Boxplot of genetic similarity between samples based on proportion of shotgun metagenomic reads in common between groups of samples for the size fractions 0.2-3, 0.8-5, 20-180 and 180-2000µm. Each box represents the read similarities between samples from two distinct oceanic locations, I: Indian Ocean; A: Atlantic Ocean, S: Southern Ocean, YR: Young ring; OR: Old ring. The analysis considers that 100 bp reads are similar if at least 2 non-overlapping 33 bp kmers are strictly identical (Compareads method, 1). Metagenome based similarity values computed by Compareads are provided in table W14.
Figure W4: Origin of the young ring at station TARA_068.
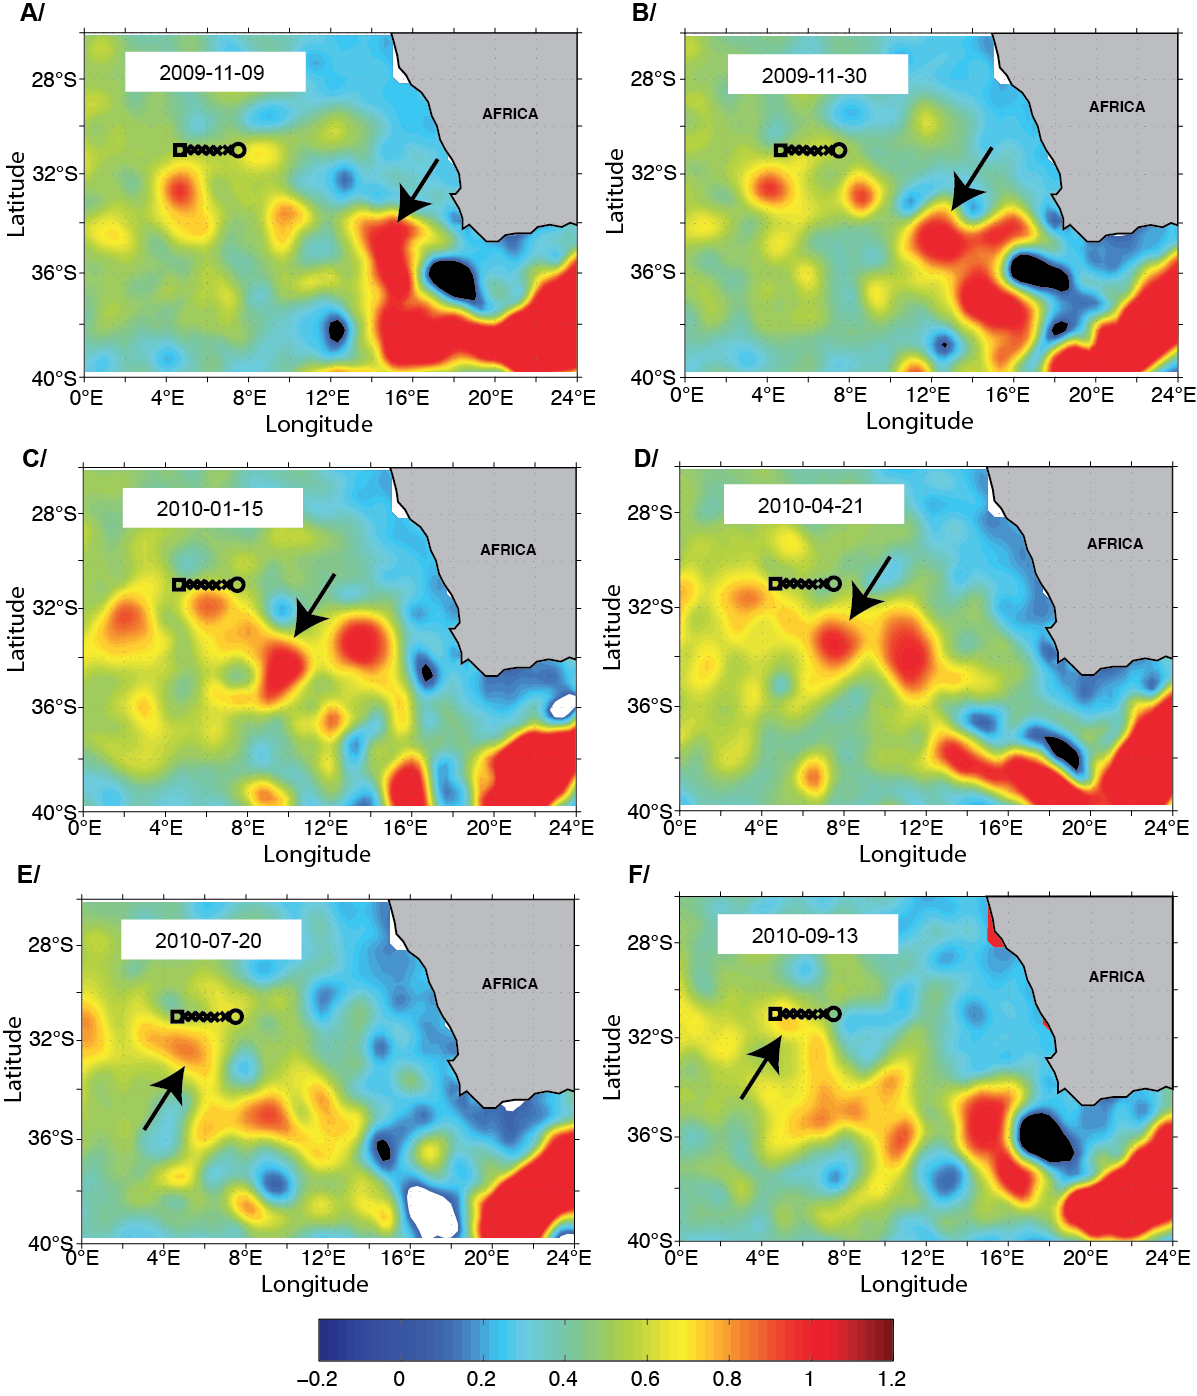
Sequence of Absolute Dynamic Topography maps illustrate the origin of the anticyclonic structure sampled at TARA_068 (square symbol). Panels A-F correspond to altimetric daily sea surface height from 09-11-2009 to 13-09-2010 (10 months preceding sampling at TARA_068). The black arrow indicates the position of the oceanic feature during its transit. Units are dyn. m.
Figure W5: Temperature and chlorophyll along the trajectory of the Agulhas rings (TARA_068 & TARA_078).
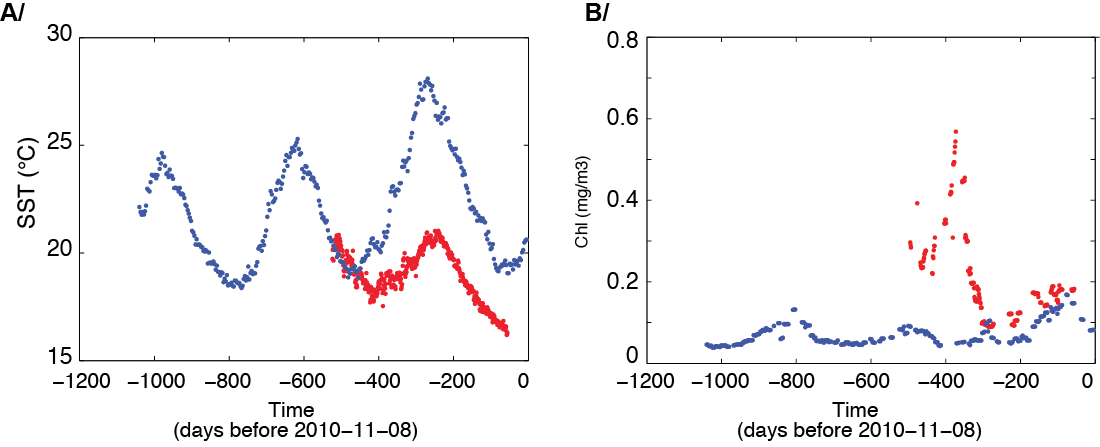
Satellite sea surface temperature (SST; A) and chlorophyll (B) along the trajectories illustrated in fig. 1. Red dots are for TARA_068 and blue dots for TARA_078. Time (in days) goes from left to right, where the origin of the abscissa (zero value) corresponds to November 8, 2010. SST was obtained from OSTIA (2; http://ghrss-tpp.metoffice.com/pages/latest_analysis/ostia.html) and ocean color chlorophyll from merged weekly maps produced by ACRI_ST (www.ACRI-ST.fr).
Figure W6: Continuous underway salinity measurements and in situ dynamic heights around young Agulhas ring station TARA_068.
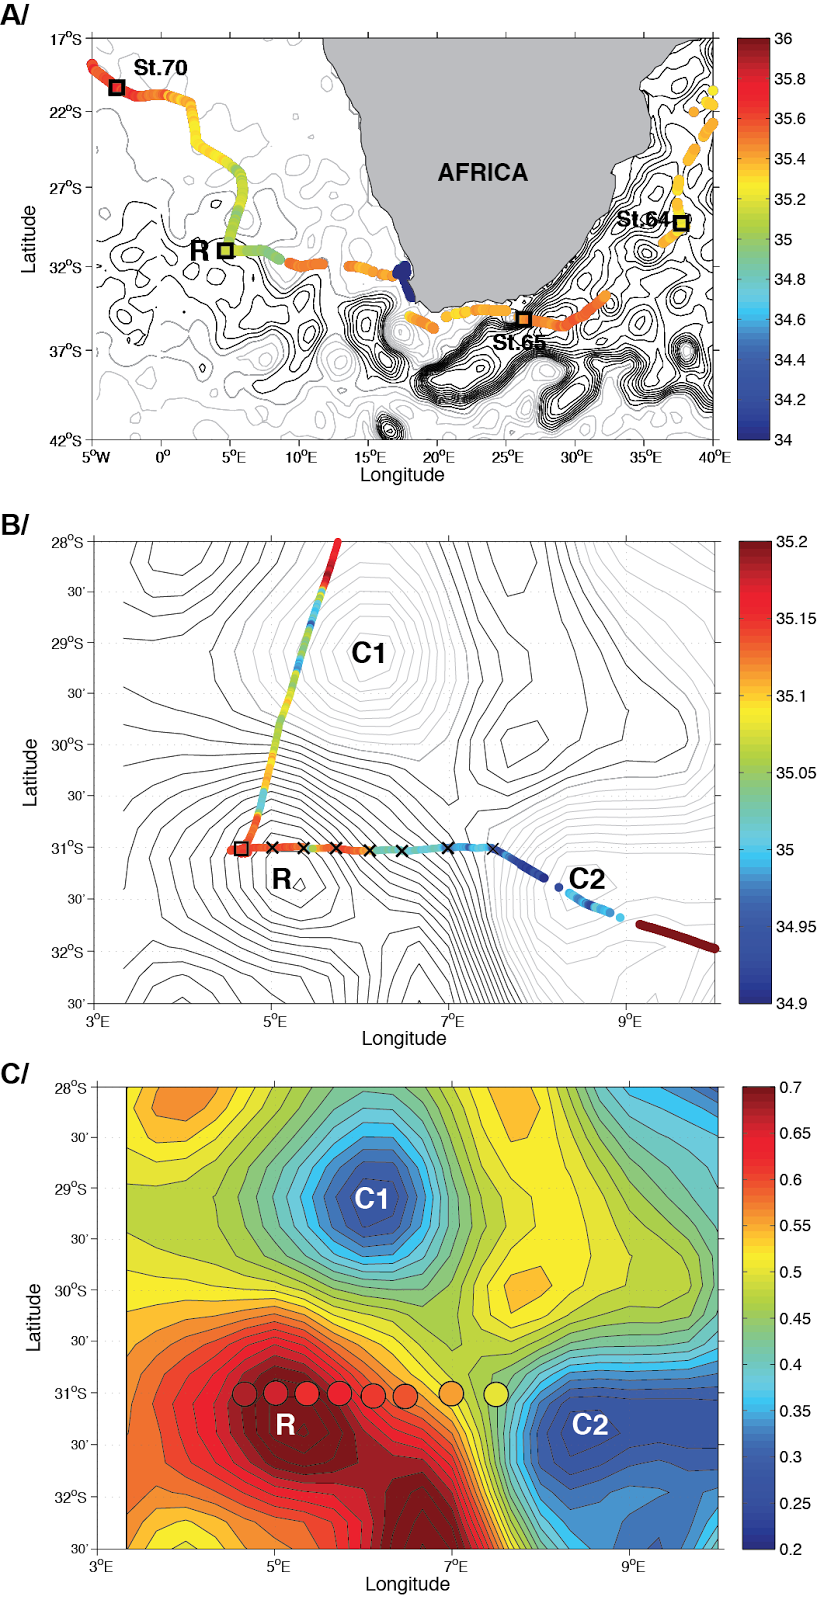
A/ Continuous surface salinity (psu) from the on-board thermosalinograph, superimposed on the altimetric daily sea surface height. Absolute Dynamic Topography were extracted from AVISO (www.aviso.altimetry.fr) for the day September 13th, 2010. The contour interval are 0.1 dyn.m. Grey isolines indicate values < 0.46 dyn.m. The squares indicate the positions of the biological sampling stations. B/ Detailed map of station TARA_068, the contour interval is 0.02 dyn.m. The crosses indicate the CTD stations while the square symbol indicates the position of the biological station. C/ Same altimetric field as in B. Dynamic heights (5m/900m) anomalies (3) evaluated using the CTD data are superimposed. The CTD-based dynamic heights increase monotonically in the westward direction, thus showing the core of the ring for the upper 1000m was actually deplaced at west of the core as it can be identified from altimetric data. The biological station coincides with the westernmost CTD station, i.e. with the CTD station with the largest dynamic height.
Figure W7: East-west transect across the young Agulhas ring at station TARA_068.
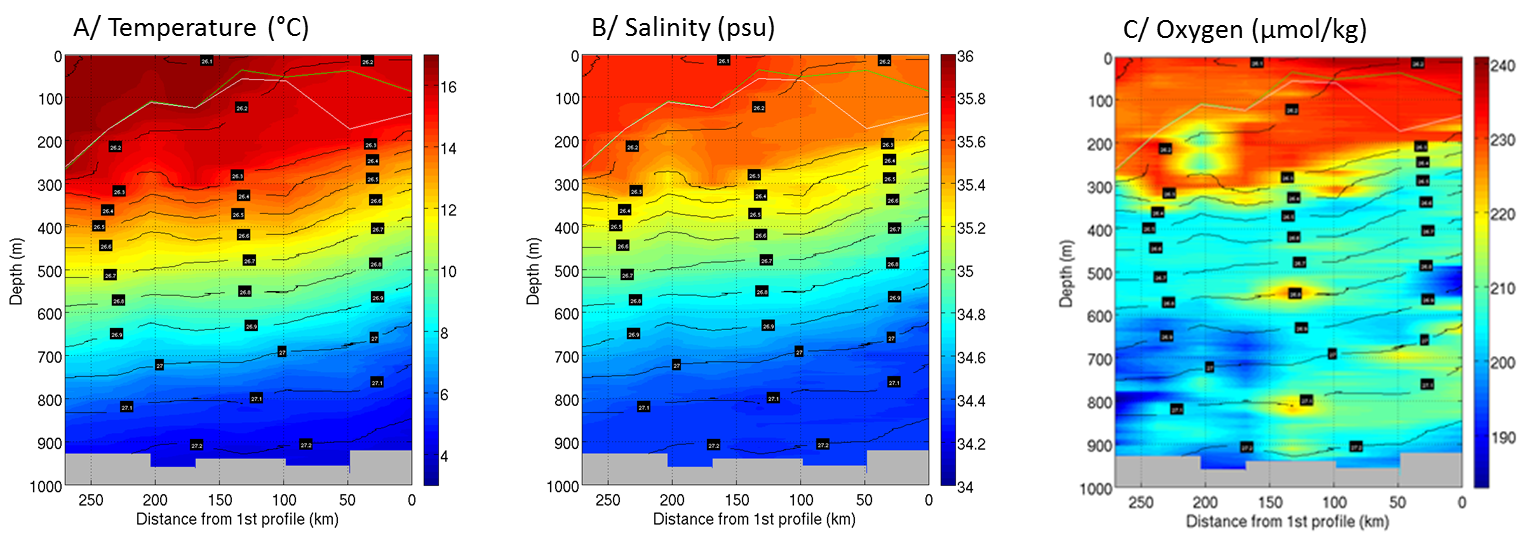
Vertical sections of the potential temperature (°C; panel A), salinity (psu; panel B) and oxygen (μmol/kg; panel C), respectively, along the transect across the young ring (Fig. S6). Isolines of potential density (σ0, kg/m3; black) and mixed layer depths based on temperature (yellow) and density criteria (green) (4) are superimposed. The abscissa indicates the distance from the first and easternmost CTD cast (units are km). The biological sampling was done at the westernmost CTD position.
Figure W8: Old ring sampling (TARA_078).

A/ Continuous Sea Surface Temperature (°C) from the onboard thermosalinograph were superimposed on the altimetric absolute dynamic topography for the day November 3rd, 2010 (the contour interval is 0.01 dyn. m.). Grey isolines indicate values under 0.66 dyn. m. The crosses indicate the positions of the CTD stations. The letter A indicates the core of the anti-cyclonic eddy in the altimetric data.
B/ Surface salinity (psu) plotted on same altimetric fields as in A/.
C/ Single salinity profiles from CTDs (colored lines; positions indicated in A/ and B/) and ARGO floats (black lines). The CTD profiles, taken within the anti-cyclonic eddy, show a deeper main halocline (i.e., the layer where the salinity vertical gradient is maximal) and higher surface values with respect to surrounding waters (ARGO data). Similarily, the temperature profiles show a deeper thermocline in the CTD casts (not shown). In both CTD and ARGO profiles a salinity minimum, i.e., the signature of the Antarctic Intermediate Water, is also clearily visible at 700-900m depth, with the CTD casts showing a deeper minimum. Both signals are thus coherent with the assumption that the structure in figure A is rather thick anticyclonic eddy and are compatible with the remnant of an Agulhas Ring.
The nearest ARGO floats available in box defined by ± 4° both in Longitude and in Latitude and ± 15 days around Tara stations were search for each CTD profile. ARGO is a global array of autonomous profiling floats that observe pressure, temperature and salinity in the upper 2000m of the ocean. These data were collected and made freely available by the International Argo Program and the national programs that contribute to it (http://www.argo.ucsd.edu, http://argo.jcommops.org). The Argo Program is part of the Global Ocean Observing System. The ARGO profiles shown here are extracted from the dataset prepared for the ARIVO global analysis (http://www.ifremer.fr/lpo/SO-Argo-France/Products/Global-Ocean-T-S) as follows: Near-Real Time data assembled by Coriolis are downloaded monthly, a climatological test is performed and the profiles are interpolated on 152 vertical levels.
Figure W9: A tiny pennate diatom was exclusively observed in Indian Ocean and young Agulhas ring stations around the African coast (TARA_064, TARA_066 and TARA_068).
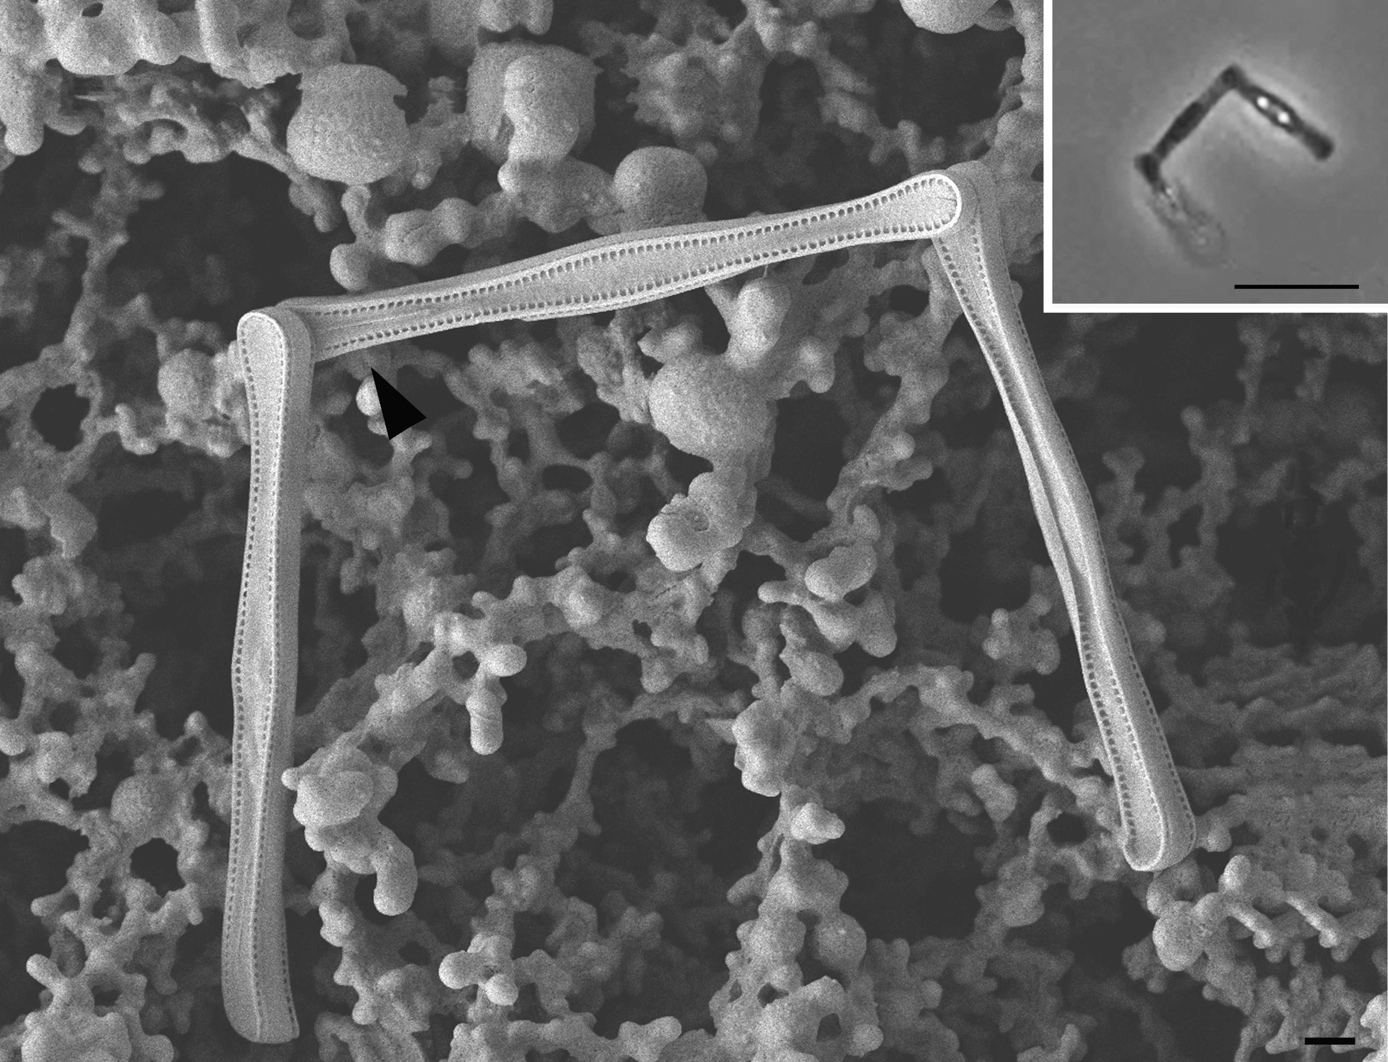
Diatom cells were connected at the valve pole, with an orthogonal or slightly obtuse angle. Electron microscopy revealed the presence of a short slit (raphe) at one pole of each valve. We identified the species as belonging to the genus Nanoneis, described by Norris R. E. (5), with Nanoneis hasleae as the type species. Norris found this species in material from the gut of salps from the midst of the Indian Ocean (301° 08’S, 78°28’ E), also reporting the presence of a similar species near Durban (South Africa) and Californian coasts of La Jolla. A second species, Nanoneis longta, was described in Chinese waters (6). The species descibed here better fits Nanoneis longta, but whether this actually is different from N. hasleae should be proved by examining more material and using molecular data. Scale bar: 1 µm (inset scale bar: 10 µm).
Figure W10: Continuous underway measurements during transect across young Agulhas ring.
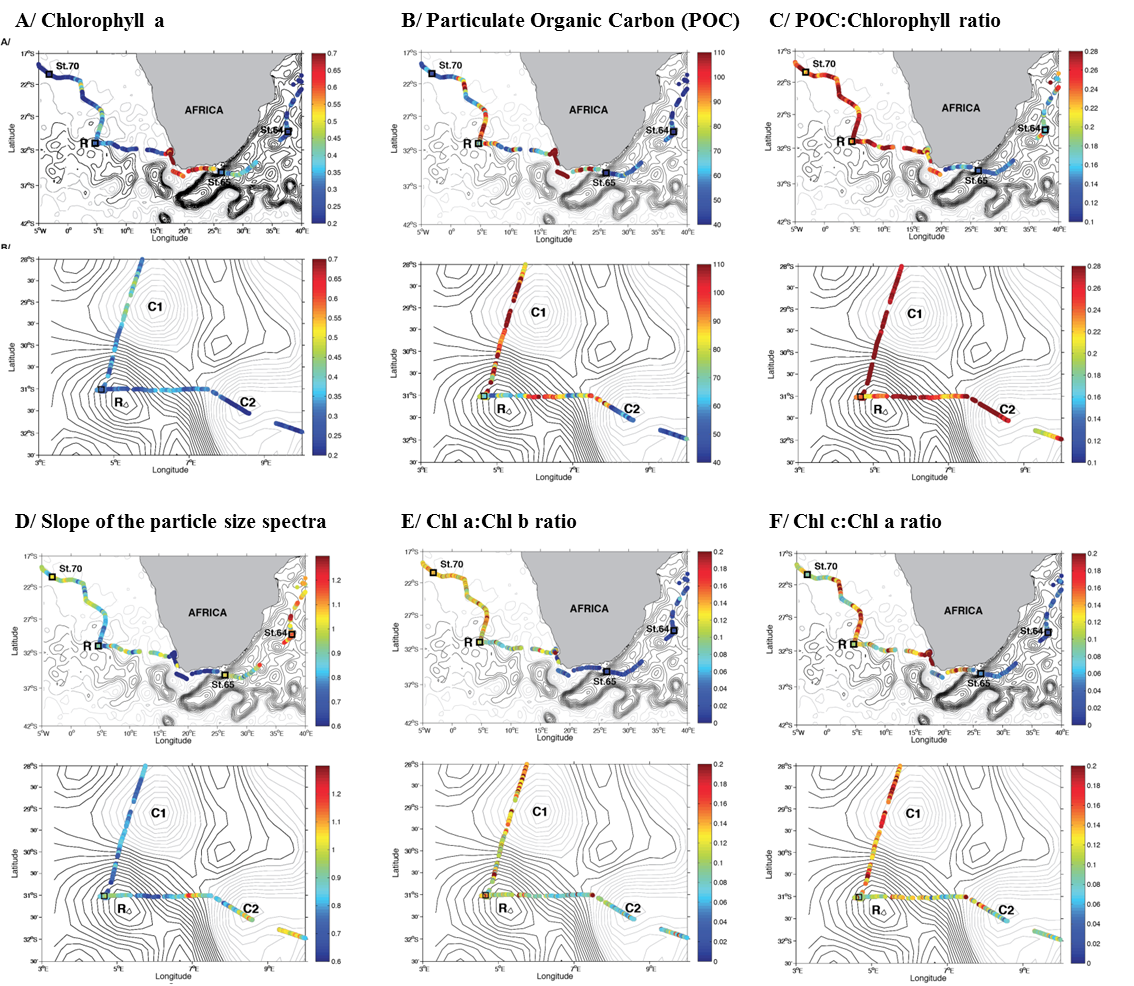
See supplementary text W1 for a comprehensive analysis of spatial gradients in the young ring community descriptors/proxies. Contour lines represent the daily Absolute Dynamic Topography (ADT). Units are dyn. m. The ADT values are for September 13th, 2010. A) Chlorophyll a determined using line height method from AC-S raw data. B) Particulate Organic Carbon (POC) estimates derived from AC-S measurements of beam attenuation. C) POC/Chlorophyll ratio estimates derived from AC-S measurements. D) Slope of the particle size spectra (γ) from AC-S measurements. E) Chlorophyll b concentration relative to chlorophyll a (green algae, e.g. Chlorophyceae, Prochlorophytes) from AC-S inversion absorption data (4). F) Chlorophyll c concentration relative to chlorophyll a, i.e., haptophytes (includes coccolithophores), and prymnesiophytes (includes Phaeocystis) from inversions of AC-S absorption (4). In each panel, the top map is the a large scale cross-basin view, the bottom map is a local view centered around the young ring TARA_068.
Figure W11: Continuous underway measurements during Tara Oceans transect across young Agulhas ring.
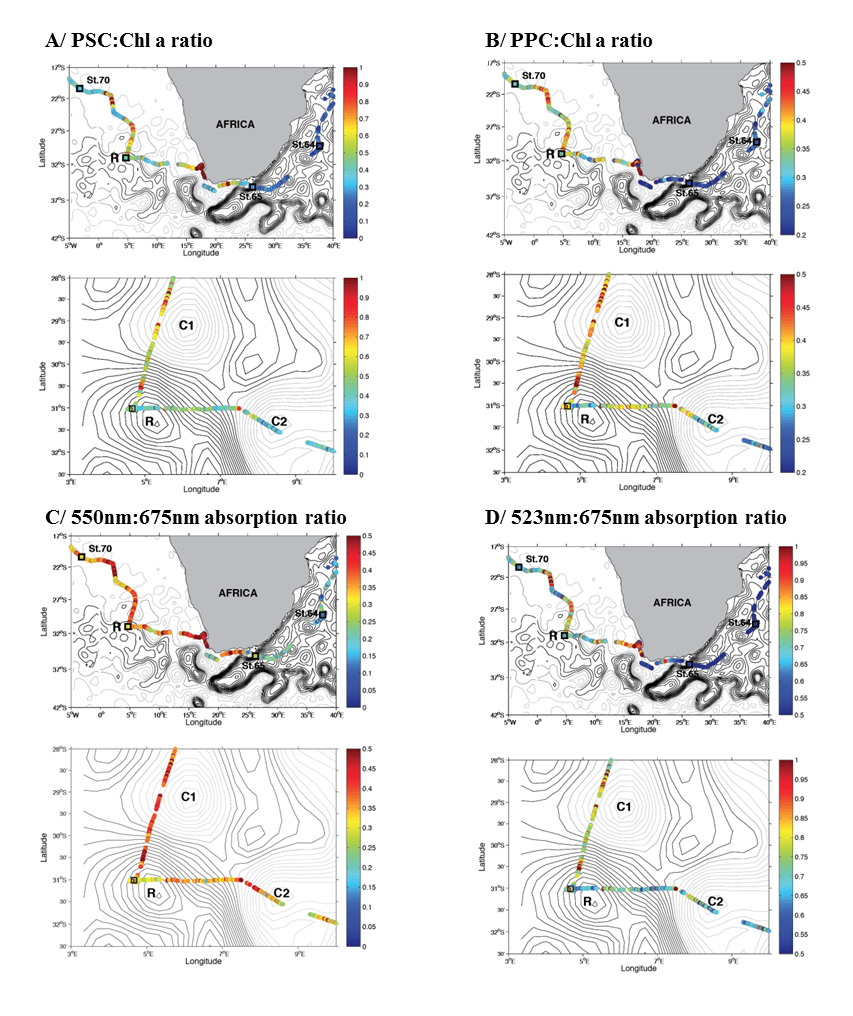
See supplementary text W1 for a comprehensive analysis of spatial gradients in the young ring community descriptors/proxies. Contour lines represent the daily sea surface height (Absolute Dynamic Topography, ADT) obtained from AVISO (www.aviso.altimetry.fr). Units are dyn. m. The ADT values are for September 13th, 2010. In each panel, the top map is the a large scale cross-basin view (as in Figure W9), the bottom map is a local view centered around the young ring station TARA_068. A/ PSC (photosynthetic carotenoid) pigments relative to chlorophyll a from AC-S inversions (4). B/ PPC (photoprotective carotenoids) pigments relative to chlorophyll a from AC-S inversions (4). C/ Absorption at 550nm relative to absorption at 675nm measured by the AC-S, which is a likely indicator of the relative presence of phycoerythrin (most likely associated with cyanobacteria). D/ Absorption at 523nm relative to absorption at 675nm measured by the AC-S, indicating the relative presence of such phytoplankton as diatoms (fucoxanthin) and other similarly-absorbing types (including dinoflagellates and their major pigment peridinin).
Figure W12: Nutrient concentration profiles for 10 stations of the study.

Concentrations in mmol/m3 measured by CTD casts are shown for nitrates (NO3), phosphates (PO4) and silicates (Si). Station numbers are indicated on each profile color coded according to station location (pink: Indian Ocean, blue: South Atlantic Ocean, green: Southern Ocean, red: Agulhas rings).
Figure W13: Time series of biogeochemical variables and functional groups within simulated Agulhas rings.
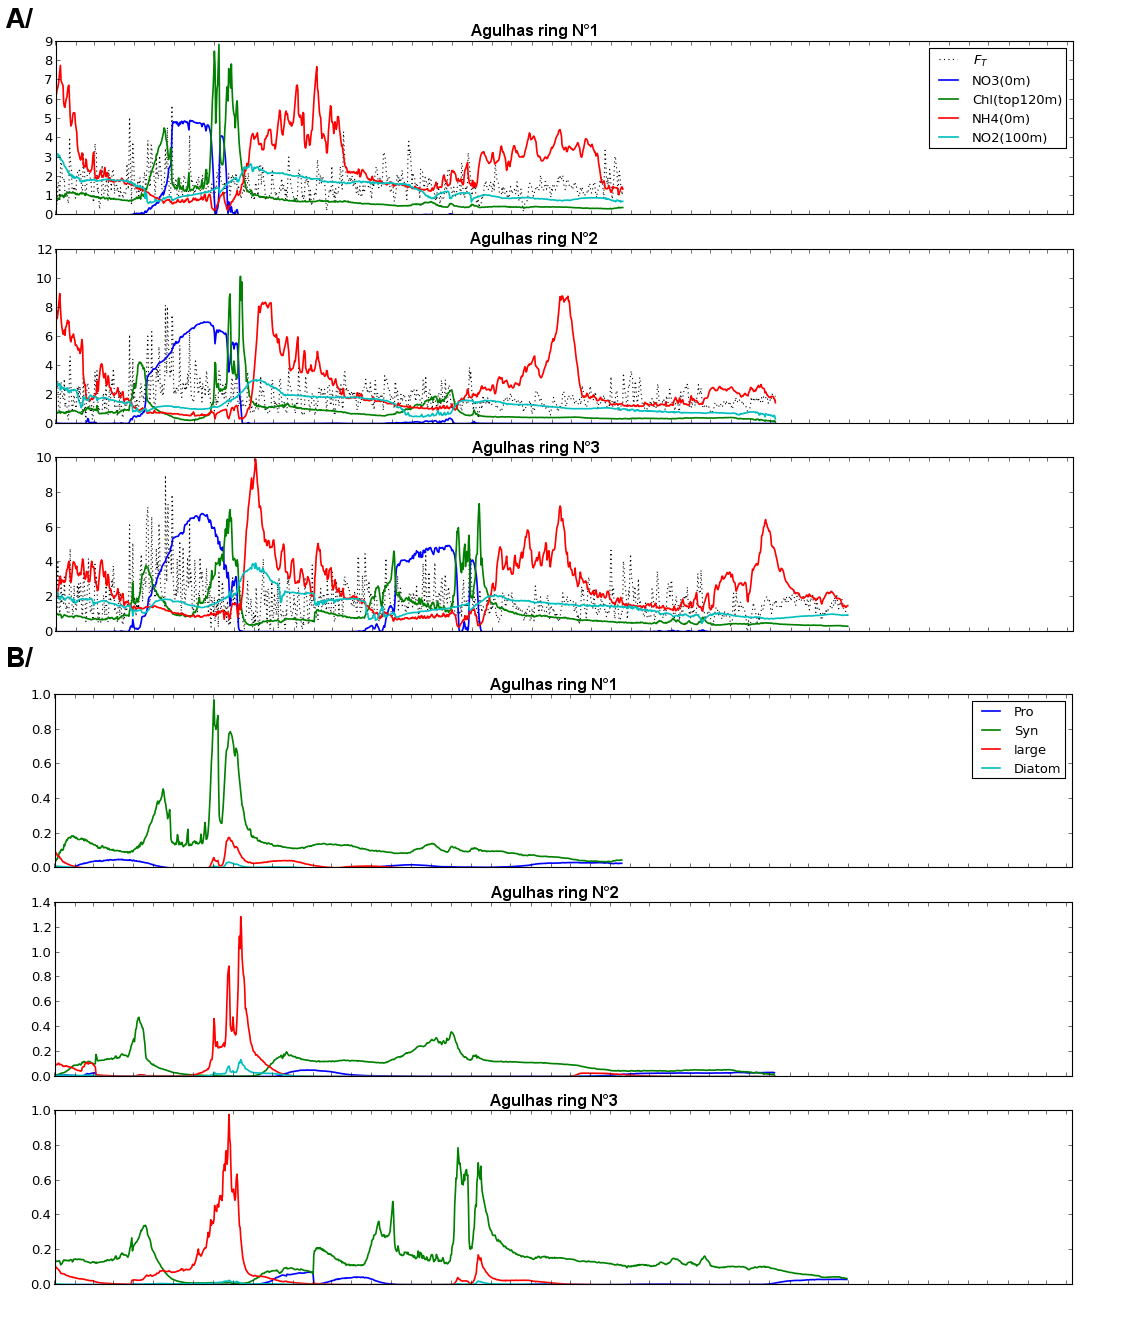
Simulations were carried out by the MIT-DARWIN model (7), and time series for three representative Agulhas rings (out of the twelve tracked in total) are presented. A/ Time series of biogeochemical variables. Blue line: NO3 (0 m); Green line: Chlorophyll (top 120 m); Red line: NH4 (0 m); light blue line: NO2 (100 m), black dotted line: surface heat loss (FT). B/ Time series of functional groups significance. Blue line: Prochlorococcus; Green line: Synechococcus; Red line: non-diatom large cells; Light blue: diatoms.
Supplementary Tables
Table S1: Samples used in the study.
Below is a summarised version of table S1; for the complete table S1, please download the full EXCEL spreadsheet with tables S1, W2-W16.
| LOCAL LABEL |
SAMPLE LABEL |
SAMPLE LABEL |
STATION LABEL |
DATE TIME |
LATITUDE |
LONGITUDE |
| Station_Depth_Fraction |
INSDC ACCESSION NUMBER |
PANGAEA ACCESSION NUMBER |
|
yyyy-mm-ddThh:mm |
decimal degree North |
decimal degree East |
| TARA_052_SUR_0.8-5 |
ERS489543 |
TARA_N000000598 |
TARA_052 |
2010-05-17T04:10 |
-16.9570 |
053.9801 |
| TARA_052_SUR_20-180 |
ERS489566 |
TARA_N000000589 |
TARA_052 |
2010-05-17T06:48 |
-16.9672 |
053.9337 |
| TARA_052_SUR_180-2000 |
ERS489523 |
TARA_N000000581 |
TARA_052 |
2010-05-17T04:10 |
-16.9567 |
053.9809 |
| TARA_064_SUR_0.8-5 |
ERS489933 |
TARA_N000000522 |
TARA_064 |
2010-07-07T04:48 |
-29.5019 |
037.9889 |
| TARA_064_SUR_20-180 |
ERS489963 |
TARA_N000000526 |
TARA_064 |
2010-07-07T07:53 |
-29.4985 |
037.9926 |
| TARA_064_SUR_180-2000 |
ERS489952 |
TARA_N000000539 |
TARA_064 |
2010-07-07T05:17 |
-29.5018 |
037.9887 |
| TARA_065_SUR_0.8-5 |
ERS490044 |
TARA_N000000959 |
TARA_065 |
2010-07-12T05:59 |
-35.1728 |
026.2868 |
| TARA_065_SUR_20-180 |
ERS490083 |
TARA_N000000968 |
TARA_065 |
2010-07-12T10:30 |
-35.2351 |
026.3022 |
| TARA_065_SUR_180-2000 |
ERS490063 |
TARA_N000000981 |
TARA_065 |
2010-07-12T06:36 |
-35.1808 |
026.2879 |
| TARA_068_SUR_0.8-5 |
ERS490281 |
TARA_N000000722 |
TARA_068 |
2010-09-14T06:55 |
-31.0266 |
004.6650 |
| TARA_068_SUR_20-180 |
ERS490256 |
TARA_N000000705 |
TARA_068 |
2010-09-13T21:35 |
-31.0551 |
004.6680 |
| TARA_068_SUR_180-2000 |
ERS490253 |
TARA_N000000709 |
TARA_068 |
2010-09-13T20:20 |
-31.0507 |
004.6603 |
| TARA_070_SUR_0.8-5 |
ERS490343 |
TARA_N000000678 |
TARA_070 |
2010-09-21T06:55 |
-20.4091 |
-003.1759 |
| TARA_070_SUR_20-180 |
ERS490362 |
TARA_N000000662 |
TARA_070 |
2010-09-21T08:23 |
-20.3943 |
-003.2085 |
| TARA_070_SUR_180-2000 |
ERS490356 |
TARA_N000000666 |
TARA_070 |
2010-09-21T07:22 |
-20.4035 |
-003.1859 |
| TARA_072_SUR_0.8-5 |
ERS490448 |
TARA_N000000831 |
TARA_072 |
2010-10-05T08:00 |
-08.7789 |
-017.9099 |
| TARA_072_SUR_20-180 |
ERS490463 |
TARA_N000000839 |
TARA_072 |
2010-10-05T09:48 |
-08.7484 |
-017.9179 |
| TARA_072_SUR_180-2000 |
ERS490457 |
TARA_N000000843 |
TARA_072 |
2010-10-05T08:20 |
-08.7726 |
-017.9150 |
| TARA_076_SUR_0.8-5 |
ERS490553 |
TARA_N000000855 |
TARA_076 |
2010-10-16T09:55 |
-20.9354 |
-035.1803 |
| TARA_076_SUR_20-180 |
ERS490572 |
TARA_N000000871 |
TARA_076 |
2010-10-16T11:18 |
-20.9514 |
-035.2273 |
| TARA_076_SUR_180-2000 |
ERS490564 |
TARA_N000000879 |
TARA_076 |
2010-10-16T10:16 |
-20.9406 |
-035.1960 |
| TARA_078_SUR_0.8-5 |
ERS490670 |
TARA_N000000620 |
TARA_078 |
2010-11-04T10:04 |
-30.1367 |
-043.2899 |
| TARA_078_SUR_20-180 |
ERS490683 |
TARA_N000001510 |
TARA_078 |
2010-11-04T13:22 |
-30.1872 |
-043.2834 |
| TARA_078_SUR_180-2000 |
ERS490679 |
TARA_N000001514 |
TARA_078 |
2010-11-04T11:31 |
-30.1506 |
-043.2877 |
| TARA_082_SUR_0.8-5 |
ERS490896 |
TARA_N000001386 |
TARA_082 |
2010-12-06T10:33 |
-47.1863 |
-058.2902 |
| TARA_082_SUR_20-180 |
ERS490911 |
TARA_N000001394 |
TARA_082 |
2010-12-06T12:32 |
-47.1966 |
-058.2349 |
| TARA_082_SUR_180-2000 |
ERS490905 |
TARA_N000001398 |
TARA_082 |
2010-12-06T11:34 |
-47.1899 |
-058.2724 |
| TARA_084_SUR_0.8-5 |
ERS491012 |
TARA_N000001438 |
TARA_084 |
2011-01-03T11:05 |
-60.2287 |
-060.6476 |
| TARA_084_SUR_20-180 |
ERS491028 |
TARA_N000001442 |
TARA_084 |
2011-01-03T13:58 |
-60.3046 |
-060.5715 |
| TARA_084_SUR_180-2000 |
ERS491021 |
TARA_N000001362 |
TARA_084 |
2011-01-03T12:17 |
-60.2584 |
-060.6226 |
| TARA_085_SUR_0.8-5 |
ERS491057 |
TARA_N000001028 |
TARA_085 |
2011-01-06T10:38 |
-62.0385 |
-049.5290 |
| TARA_085_SUR_20-180 |
ERS491074 |
TARA_N000001036 |
TARA_085 |
2011-01-06T15:29 |
-62.1400 |
-049.3273 |
| TARA_085_SUR_180-2000 |
ERS491070 |
TARA_N000001040 |
TARA_085 |
2011-01-06T12:45 |
-62.0773 |
-049.4534 |
| TARA_052_DCM_0.22-1.6 |
ERS489590 |
TARA_Y100000176 |
TARA_052 |
2010-05-17T11:42 |
-16.9534 |
53.9601 |
| TARA_052_SUR_0.22-1.6 |
ERS489534 |
TARA_Y100000166 |
TARA_052 |
2010-05-17T04:10 |
-16.957 |
53.9801 |
| TARA_056_SUR_0.22-3 |
ERS489712 |
TARA_B000000609 |
TARA_056 |
2010-06-26T07:05 |
-15.3424 |
43.2965 |
| TARA_057_SUR_0.22-3 |
ERS489732 |
TARA_B000000563 |
TARA_057 |
2010-06-27T12:05 |
-17.0248 |
42.7401 |
| TARA_058_DCM_0.22-3 |
ERS489846 |
TARA_B000000557 |
TARA_058 |
2010-06-29T15:00 |
-17.2855 |
42.2866 |
| TARA_062_SUR_0.22-3 |
ERS489877 |
TARA_B000000532 |
TARA_062 |
2010-07-03T08:09 |
-22.3368 |
40.3412 |
| TARA_064_DCM_0.22-3 |
ERS490001 |
TARA_B000000507 |
TARA_064 |
2010-07-08T06:21 |
-29.5333 |
37.9117 |
| TARA_064_SUR_0.22-3 |
ERS489917 |
TARA_B100000401 |
TARA_064 |
2010-07-07T04:48 |
-29.5019 |
37.9889 |
| TARA_065_DCM_0.22-3 |
ERS490085 |
TARA_B000000441 |
TARA_065 |
2010-07-12T11:03:22 |
-35.2421 |
26.3048 |
| TARA_065_SUR_0.22-3 |
ERS490029 |
TARA_B000000437 |
TARA_065 |
2010-07-12T05:59 |
-35.1728 |
26.2868 |
| TARA_068_DCM_0.22-3 |
ERS490296 |
TARA_B100000482 |
TARA_068 |
2010-09-14T13:30 |
-31.027 |
4.6802 |
| TARA_068_SUR_0.22-3 |
ERS490265 |
TARA_B100000475 |
TARA_068 |
2010-09-14T06:55 |
-31.0266 |
4.665 |
| TARA_070_SUR_0.22-3 |
ERS490327 |
TARA_B100000459 |
TARA_070 |
2010-09-21T06:55 |
-20.4091 |
-3.1759 |
| TARA_072_DCM_0.22-3 |
ERS490475 |
TARA_B100000426 |
TARA_072 |
2010-10-05T15:35 |
-8.7296 |
-17.9604 |
| TARA_072_SUR_0.22-3 |
ERS490433 |
TARA_B100000424 |
TARA_072 |
2010-10-05T08:00 |
-8.7789 |
-17.9099 |
| TARA_076_DCM_0.22-3 |
ERS490597 |
TARA_B100000519 |
TARA_076 |
2010-10-16T16:58:37 |
-21.0292 |
-35.3498 |
| TARA_076_SUR_0.22-3 |
ERS490538 |
TARA_B100000517 |
TARA_076 |
2010-10-16T09:55 |
-20.9354 |
-35.1803 |
| TARA_078_DCM_0.22-3 |
ERS490691 |
TARA_B100000530 |
TARA_078 |
2010-11-04T18:16:53 |
-30.1484 |
-43.2705 |
| TARA_078_SUR_0.22-3 |
ERS490655 |
TARA_B100000528 |
TARA_078 |
2010-11-04T10:04 |
-30.1367 |
-43.2899 |
| TARA_082_DCM_0.22-3 |
ERS490924 |
TARA_B100000829 |
TARA_082 |
2010-12-06T18:58 |
-47.2007 |
-57.9446 |
| TARA_082_SUR_0.22-3 |
ERS490881 |
TARA_B100000827 |
TARA_082 |
2010-12-06T10:33 |
-47.1863 |
-58.2902 |
| TARA_084_SUR_0.22-3 |
ERS490997 |
TARA_B100000782 |
TARA_084 |
2011-01-03T11:05 |
-60.2287 |
-60.6476 |
| TARA_085_DCM_0.22-3 |
ERS491090 |
TARA_B100000796 |
TARA_085 |
2011-01-06T19:34:21 |
-62.2231 |
-49.2139 |
| TARA_085_SUR_0.22-3 |
ERS491040 |
TARA_B100000789 |
TARA_085 |
2011-01-06T10:38 |
-62.0385 |
-49.529 |
Tables S1, W2-W16.
Download:
Villar_et_al_Supp_Tabs.xls
This spreadsheet file contains (one sheet per table) the following:
- Table S1: Sample accession numbers in PANGAEA and INDSC archives.
- Table W2: CTD rosette and nutrient measurements for each station for surface (SUR) and Deep Chlorophyll Maximum (DCM).
- Table W3: Mixed layer depth measured with CTD, and maximum of fluorescence derived from rosette-mounted fluorimeter.
- Table W4: Eukaryota diversity estimated by V9 rDNA barcodes.
- Table W5: Zooplankton abundances in the >200 µm size fraction estimated by imagery.
- Table W6: Phytoplankton abundance in the 20-180 µm size fraction estimated by pigment content.
- Table W7: Tintinnid counts of the 20-180µm size fractions.
- Table W8: Diatom counts for the 20-180µm size fractions.
- Table W9: Dinoflagellates counts for the 20-180µm size fractions.
- Table W10: Bacteria and picoeukaryote abundances in the 0.2-3µm size fraction samples estimated using flow cytometry.
- Table W11: Bacterial abundances in the 0.2-3µm size fraction samples estimated from metagenomes.
- Table W12: Nucleocytoplasmic large DNA virus (NCLDV) abundances in the 0.2-3µm size fractions.
- Table W13: Basin pairwise genetic comparisons: V9 rDNA barcodes and metagenomic reads.
- Table W14: Genetic similarities between surface stations for size fraction.
- Table W15: KEGG orthologs related to nitrogen cycle differently represented in the young ring.
- Table W16: Parameters of the carbonate system at Tara Oceans stations 68 and 78 as well as at nearby stations.
Supplementary Texts
Text W1: Spatial gradients in the young ring community descriptors/proxies.
To further describe the ecosystem modifications that occurred within rings during their journey from the Indian Ocean into the South Atlantic Ocean, we present the description of the horizontal gradients across the Agulhas choke point (i.e. from Madagascar to the eastern side of the South Atlantic basin), as well as the local gradients characterising station TARA_068 (young Agulhas ring). Throughout the expedition an on-board continuous flow-through system allowed characterization of the optical properties of the surface water. As described in the methods section below, a set of key ecosystem properties (taxonomic composition, metabolic states) can be derived from these optical data. To aid interpretation, i.e. the relation with the pattern of the oceanic currents, the resulting ecosystem descriptors have been superimposed on the altimetry data.
Methodology
A continuous flow-through system was used for data collection during the Tara Oceans expedition resulting in high temporal and spatial resolution optical and hydrographic data. The flow-through set-up pumped water through a high-spectral-resolution spectrophotometer (AC-S, WET Labs, Inc.), and the flow was diverted through a 0.2μm filter for 10 minutes once per hour or 5 minutes once per half hour in coastal water (1). Periodic diversion through the filter results in a calibration-independent method for determining particulate absorption and attenuation spectra by differencing the total and filtered water fractions. The AC-S measures the absorption and attenuation spectra of light at a frequency of 2Hz, or approximately 120 spectra per minute, and the flow-through water intake is at approximately 1.5 meters below the sea surface. AC-S spectra are processed after collection with 1-minute averaging applied to reduce noise.
At stations along the cruise path, water samples were collected coincidentally with the AC-S data using Niskin bottles deployed on a rosette for analysis of pigment concentrations using High Performance Liquid Chromatography (HPLC); HPLC methodology follows that of Ras et al. (2), adapted from Van Heukelem and Thomas (3). Pigment concentrations from HPLC were compared to absorption by different pigment groups determined by spectral decomposition of the AC-S 1-minute binned absorption spectra. Successful comparisons between these two pigment detection methods allow for use of the entire continuous spectral absorption data set (further binned to 1-km2 resolution; 69,944 data points along the Tara Oceans trajectory), to show global distributions of different phytoplankton pigment concentrations (4). Concentrations of phytoplankton pigments are related to the presence of different phytoplankton taxa characterized by different photosynthetic pigments. Results of the spectral decomposition method for determining pigment concentrations provide information on chlorophylls a, b, and c, as well as grouped photosynthetic (PSC) and photoprotective (PPC) carotenoid pigments.
In addition to phytoplankton pigment concentrations, estimates of a phytoplankton size parameter (γ, 5), total chlorophyll a concentration, and particulate organic carbon (POC) are derived from the absorption and attenuation spectra for the same 1-km2-binned Tara Oceans data set (6). Calculations of these and the pigment concentration parameters, together with estimated errors, are provided in detail in Chase et al. (4) and Boss et al. (6).
Results
The area across the Agulhas choke point can be roughly divided into three main sub-regions: the Agulhas Current System (AC; east and south of South Africa), a transitional region (up to the southernmost region of the Benguela Upwelling) directly impacted by the South African shelf (SAS) dynamics and Cape Basin (CB), in the near South Atlantic. Recall that the seasons progress from fall for the Indian Oceans stations to winter for the near Atlantic ones, characterised by deeper mixing layers. Interestingly, as illustrated in the following, despite the change in the season, sharp gradients in the ecosystem properties characterise the transition from one system to another, with a surprisingly good correspondence between the optically-derived data and the oceanographic features. This suggests that local abiotic and biotic characteristics are more or at least as important as the time of year of the sampling.
In the Atlantic, off the shelf, chlorophyll values are depleted compared to the South African shelf, despite the season (Winter, Figure W10A). A closer look at the ring properties (Figure W10A) reveals that its core is largely depleted while relatively higher values characterise the cyclonic eddy north of it, possibly originating in the Benguela Upwelling.
The higher productivity on the shelf, related to upwelling processes, is reflected also in the Particulate Organic Carbon (POC) content (Figure W10B). In the latter case, the CB has a relatively high carbon content too and, in addition, is characterised by intense, small scale gradients (Figure W10B). These gradients can be observed even in the ring itself, where a very small depleted core is surrounded by relatively carbon-rich waters.
Despite the higher chlorophyll and POC content on the shelf, the POC/Chl ratio, which might inform on the phytoplankton physiology (7), shows a very different pattern (Figure W10C). Specifically, it shows a marked bimodal pattern, with relatively higher values in the western regions of the study area, including the ring surroundings. Again, a small, anomalous ring core is visible in the data (Figure W10C). In principle, this index could be associated with the community photoacclimation state or with other specific photosynthetic parameters (7, 8) but it is difficult to disentangle the role of the various processes without additional data. Here we limit ourselves to noting that the entire CB has high POC/Chl, irrespective of the nature and the origins of its oceanographic structure. Evidently, this is true also for the Agulhas rings and thus it can be stated that transit into the Atlantic Ocean implies a sharp change in the photosynthetic properties.
The particle size, as estimated from the particulate attenuation spectral slope (Figure W10D), reveals that larger cells characterise the highly productive shelf region. Locally in the ring (D), the core contains particles smaller than the surrounding waters. The transition from the Indian to the Atlantic Ocean corresponds also to an increased importance of green algae (with high chlorophyll b values; Figure W10E) and of other algal groups (with high chlorophyll c values; Figure W10F). While the first group is found especially in the Cape Basin, the second ones become important already at the transition from the AS to the shelf region. At the ring, the core has relatively lower chlorophyll c values than the surroundings. Chlorophyll c is associated with the presence of Chromophytes such as diatoms and coccolithophores.
Other pigments are also highly variable, with generally lower relative values of photosynthetic carotenoids (Figure W11A) in the AC and in the CB. This is true also for the ring core when compared with the waters around it. A sharp gradient from east to west is also observed in the photoprotective pigments (Figure W11B), higher in the CB but not in the ring core.
The optical estimate of phycoerythrin content, a pigment most likely related to the presence of Cyanobacteria, generally reveals a doubling of importance when moving west from the AC (Figure W11C), with the exception of the ring core, whose values are lower than those typical of the CB. On the contrary, and as expected, diatoms (Figure W11D) are dominant only in the Benguela Upwelling (on the western coast of South Africa) but they are generally more important in the CB than in the AC, in the western Indian Ocean. Here again the ring core can be identified as anomalous with respect to the CB resident waters since it is characterized by a relatively low diatom content.
Bibliographic references
- N. Maillet, C. Lemaitre, R. Chikhi, D. Lavenier, P. Peterlongo, Compareads: comparing huge metagenomic experiments. BMC Bioinformatics. 13, S10 (2012).
- C. J. Donlon et al., The operational sea surface temperature and sea ice analysis (OSTIA) system. Remote Sensing of Environment. 116, 140–158 (2012).
- H. U. Sverdrup, M. W. Johnson, R. H. Fleming, et al., The Oceans: Their physics, chemistry, and general biology (Prentice-Hall New York, 1942), vol. 1087.
- C. de Boyer Montégut, G. Madec, A. S. Fischer, A. Lazar, D. Iudicone, Mixed layer depth over the global ocean: An examination of profile data and a profile-based climatology. J. Geophys. Res. 109, C12003 (2004).
- Y. Li, Y.-H. Gao, C.-P. Chen, J.-R. Liang, Nanoneis, a newly recorded diatom genus from China and Nanoneis longta sp. nov. Acta botanica sinica-english edition-. 46, 788–792 (2004).
- R. Norris, A new planktonic diatom, Nanoneis hasleae gen. et sp. nov. Norwegian J. Bot. 20, 321–325 (1973).
- W. H. Slade et al., Underway and Moored Methods for Improving Accuracy in Measurement of Spectral Particulate Absorption and Attenuation. J. Atmos. Oceanic Technol. 27, 1733–1746 (2010).
- J. Ras, H. Claustre, J. Uitz, Spatial variability of phytoplankton pigment distributions in the Subtropical South Pacific Ocean: comparison between in situ and predicted data. Biogeosciences. 5, 353–369 (2008).
- L. Van Heukelem, C. S. Thomas, Computer-assisted high-performance liquid chromatography method development with applications to the isolation and analysis of phytoplankton pigments. Journal of Chromatography A. 910, 31–49 (2001).
- A. Chase et al., Decomposition of in situ particulate absorption spectra. Methods in Oceanography. 7, 110–124 (2013).
- E. Boss, M. S. Twardowski, S. Herring, Shape of the particulate beam attenuation spectrum and its inversion to obtain the shape of the particulate size distribution. Appl. Opt. 40, 4885–4893 (2001).
- E. Boss et al., The characteristics of particulate absorption, scattering and attenuation coefficients in the surface ocean; Contribution of the Tara Oceans expedition. Methods in Oceanography. 7, 52–62 (2013).
- M. J. Behrenfeld, E. Boss, The beam attenuation to chlorophyll ratio: an optical index of phytoplankton physiology in the surface ocean? Deep Sea Research Part I: Oceanographic Research Papers. 50, 1537–1549 (2003).
- M. J. Behrenfeld, E. Boss, D. A. Siegel, D. M. Shea, Carbon-based ocean productivity and phytoplankton physiology from space. Global Biogeochem. Cycles. 19, GB1006 (2005).
Tara Oceans Contributors
Abdulla Ameer, Abergel Chantal, Allemand Denis, Amiel Aldine, Anderson Leif, Antoine David, Arrigoni Roberto, Arslan Defne, Artiguenave Francois, Audic Stephane, Aury Jean-Marc, Bachelier Celine, Bailly Xavier, Baker Andrew, Balestra Cecilia, Barone Benedetto, Basso Daniela, Bayley Daniel, Beaugrand Gregory, Beguery Laurent, Benito-Guttierez Elia, Beraud Eric, Bigot Lionel, Bittner Lucie, Boccara Martine, Boonstra Roxane, Boutte Christophe, Brunet Christophe, Bricaud Annick, Brum Jennifer, Capoulade Jeremie, Caputi Luigi, Caragnano Annalisa, Carmichael Margaux, Casotti Raffaela, Cetinic Ivona, Chaffron Samuel, Chambouvet Aurélie, Chang Patrick, Chase Ali, Chica Claudia, Claustre Hervé, Claverie Jean-Michel, Clerissi Camille, Colin Sebastien, Coll-Lladó Montse, Comeau Steeve, Conrad Christian, Cornejo Miguel Francisco, Cornejo Marcella, Cossa Daniel, Cousin Maryam, Cruaud Corinne, Cuck Corrine, D’Ottone Marcela, Da Silva Corinne, Dausse Denis, de la Broise Denis, De Monte Silvia, Decelle Johan, Deidun Alan, del Campo Javier, Derelle Evelyne, Desdevises Yves, Desgranges Elodie, Desplanches Valerie, Despres Floriane, Desreumaux Nicolas, di Mauro Rosanna, Dimier Celine, Dolan John, D'Ortenzio Fabrizio, d'Ovidio Francesco, Doye Anne, Duhaime Melissa, Duperche Emilie, Durrieu de Madron Xavier, Dutkiewicz Stephanie, Faust Karoline, Felden Janine, Fernández Beatriz, Ferrera Isabel, Ferriere Regis, Ferrier-Pagès Christine, Friedrich Rainer, Ganachaud Alexandre, Garczarek Laurence, Gasol Josep M, Gasparini Stéphane, Gattuso Jean-Pierre, Gilkes Gabriella, Gillette Jennifer, Grant Brett, Grisoni Jean-Michel, Groc Michel, Guidi Lionel, Guigand Cedric, Gutierrez-Herredia Luis, Hellig Roland, Huang Danwei, Ignacio-Espinoza Julio, Jamet Jean-Louis, Katinka Michael, Kitano Yuko, Kolber Zbigniew, Koubbi Philippe, Kukami Hironobu, Labadie Karine, Labbe-Ibanez Pamela, Larsson Tomas, Lazar Alban, Le Goff Herve, Le Quere Corinne, Leander Brian, Lebaron Philippe, LeBescot Noan, Lefort Thomas, Legendre Louis, Lejeusne Christophe, Lepoivre Cyrille, Lescot Magali, Lewis Mangan, Leymarie Edouard, Lima Mendez Gipsi, Logares Ramiro, Mahé Frédéric, Maier Cornelia, Malviya Shruti, Marcolin Catarina, Marec Claudie, Marinesque Sophie, Massana Ramon, Mattio Lydiane, Mazzochi Maria Grazia, Morard Raphaël, Moreau Hervé, Morin Pascal, Morisset Simon, Mountain David, Muir Paul, Nelson Harry, Nicaud Sophie, Nival Paul, Noel Benjamin, Obolensky Grigor, Obura David, Pages Philippe, Payri Claude, Paz Yepes Javier, Pedros-Alio Carlos, Pelletier Eric, Pepperkok Rainer, Perault Fabien, Perez Yvan, Picheral Marc, Pichon Michel, Piganeau Gwenaël, Pillay Ruby, Poirot Olivier, Poulain Julie, Poulton Nicole, Prejger Franck, Prihoda Judith, Probert Ian, Procaccini Gabriele, Rampal Jeannine, Ras Josephine, Reynaud Stephanie, Ribalet Francois, Ribera d'Alcala Maurizio, Roettinger Eric, Romac Sarah, Romagnan Jean-Baptiste, Rottier Cecile, Roullier Francois, Rouviere Christian, Royer Anne, Royo Llonch Marta, Sailerova Martina, Salazar Guillem, Samson Gaelle, Santini Sébastien, Sarno Diana, Sarmento Hugo, Scalco Eleonora, Scarpelli Claude, Sciandra Antoine, Searson Sarah, Siano Raffaele., Silva Bianca, Simakov Oleg, Solonenko Sergei, Spezzaferri Silvia, Stalder Fabio, Stefani Fabrizio, Stefansson Halldor, Stelzer Ernst, Subirana Lucie, Swalwell Jarred, Taillandier Vincent, Tambutté Eric, Tambutté Sylvie, Tanaka Atsuko, Taupier-Letage Isabelle, Testor Pierre, Thompson Anne, Thuillier Doris, Tichanné-Seltzer Virgine, Tirichine Leila, Toulza Eve, Tozzi Sasha, Tremblay Jean-Éric, Tribollet Aline, Triller Antoine, Vannier Thomas, Velayoudon Didier, Veluchamy Alaguraj, Villar Emilie, Vincent Flora, Wallace Carden, Weinbauer Markus, Williams Maureen, Yau Sheree, Yelton Alexis, Zingone Adriana, Zoccola Didier.
Tara Oceans Coordinators
Acinas Silvia G., Bork Peer, Boss Emmanuel, Bowler Chris, De Vargas Colomban, Follows Mick, Gorsky Gabriel, Grimsley Nigel, Hingamp Pascal, Iudicone Daniele, Jaillon Olivier, Kandels-Lewis Steffi, Karp-Boss Lee, Karsenti Eric, Krzic Uros, Not Fabrice, Ogata Hiroyuki, Pesant Stephane, Raes Jeroen, Reynaud Emmanuel G., Sardet Christian, Sieracki Mike, Speich Sabrina, Sullivan Matt, Sunagawa Shinichi, Stemmann Lars, Velayoudon Didier, Weissenbach Jean, Wincker Patrick.
Access to Data
Environmental Data
Tara Oceans environmental data and sampling metadata are available at PANGAEA under project label "TOC". The list of PANGAEA sample accession numbers (e.g. TARA_A100000357) specifically used in the present Agulhas system study are provided in table S1.
Raw Sequence Data
The Tara Oceans nucleotide sequences are available at the European Nucleotide Archive (ENA) under project ID PRJEB402. The list of sequence run identifiers (e.g. ERR562362) specifically used in this study are provided in de Vargas et al. (see below "V9 rDNA barcode data") and Sunagawa et al. ("Annotated Metagenomes").
V9 rDNA barcode Data
An annotated database of the complete Tara Oceans V9 rDNA Data barcodes dataset (including the subset used in this study) is available on the companion web site for de Vargas et al. (2015).
Annotated Metagenomes
An annotated database of the complete 0.2-3 µm metagenome dataset (including the subset used in this study) is available on the companion web site for Sunagawa et al. (2015).