due to the accumulation
of small deletions
Hiroyuki Ogata, Wataru Fujibuchi, Minoru Kanehisa*
Institute for Chemical Research,
Kyoto University, Uji, Kyoto 611, Japan
*Corresponding author: Minoru Kanehisa, Institute for Chemical Research, Kyoto University
Uji, Kyoto 611, Japan, E-mail: kanehisa@kuicr.kyoto-u.ac.jp
Abstract
In order to investigate the molecular mechanisms that alter the intron size, we conducted an extensive interspecies comparison of homologous introns among three mammalian groups: human, artiodactyls, and rodents. The size difference of introns was statistically significant among all the three groups, and the intron was the longest for human and the shortest for rodents. The intron size difference appears to be due to the accumulation of small deletions, according to the separate count of insertion and deletion frequencies. The distribution of intron size differences also has a shape similar to the distribution of insertion/deletion sizes found in pseudogenes. It is suggested that introns are selectively neutral to small-scale changes of the genome size, which inherently contain the bias of favoring short deletions against short insertions.
Key words: Intron; Size difference;
Deletion; Insertion; Mutation rate; Isochore family
1. Introduction
Since the discovery of introns, an extensive body of research has characterized the intron/exon organization of eukaryotic genes, and has contributed to the understanding of the evolutionary history of introns and associated molecules [1-5]. One of the major features of the intron structure uncovered by statistical analyses is the distribution profile of intron sizes. In contrast to the size distribution of exons which is more like a normal distribution with a peak around ~120 nt, the size distribution of introns is asymmetric with a smaller peak around ~90 nt and a long trailing tail. The biological implication of this feature is still unclear, but in terms of a practical aspect the existence of long introns makes the prediction of coding regions difficult. Thus, we wish to identify any determinant factors that govern the distribution of intron lengths. This paper presents new statistical features that have been identified from the existing DNA sequence data, which may be interpreted in the context of molecular mechanisms that change the size of an intron.
Recent studies reporting on the size differences between human and avian introns and between human and mouse introns [6,7] seem to give a clue for elucidating the underlying molecular mechanisms of intron size alterations. Both studies suggest that organisms with smaller genome sizes have shorter introns. Thus, there could be a correlation between the macroscopic genome structure and the microscopic intron structure. The size of a genomic sequence can be changed by insertions and deletions, although a number of different molecular mechanisms may be involved. In contrast to the point mutations that have been extensively analyzed, especially in coding regions, the insertions and deletions have not been well analyzed because of the scarcity of data and the difficulty of alignment. We have accumulated by far the largest data set of orthologous genes from three mammalian orders: Primates, Artiodactyla, and Rodentia. We focus our analysis mostly on introns because there are now enough data available, because the intron boundaries are well-defined, and because the alignment is not difficult for closely related organism groups.
The accumulation of deletions is
reported to be faster than that of insertions in DNA sequences of human
processed pseudogenes [8]. Because the bias between deletions and insertions
may be a major factor that determines the intron size, we examine whether
this tendency holds true or not for genic non-coding sequences, i.e., non-coding
sequences adjacent to protein coding regions, especially introns. The statistical
analysis presented here focuses on (1) the separate counts of insertions
and deletions, (2) the comparison of the lengths of orthologous introns
between two organism groups to estimate insertion/deletion events, and
(3) the correlation of intron size differences with the chromosomal positions.
2. Materials and methods
2.1. Extraction of sequence data
DNA sequences were selected from GenBank release 89. All DNA and cDNA sequences with annotations of protein coding sequences (CDS) were extracted when they contained both the start and stop codons. There were 6429 human sequences, 6681 rodent sequences, and 1316 artiodactyl sequences. Among them 614 human, 556 rodent, and 100 artiodactyl sequences contained introns.
Interspecies comparisons require identification of orthologous relations of genes from a pair of species. With the assistance of HOVERGEN (Homologous Vertebrate Genes) database release 13 [9], which contained phylogenetic trees and multiple sequence alignments of a number of protein groups, we constructed orthologous gene date sets. We omitted the following sequences because of ambiguous orthology: MHC class I and II families, immunoglobulin family, and T-cell receptor family. As the result, we obtained 457 intron pairs from 106 human/rodent genes, 77 intron pairs from 31 human/artiodactyl genes, 76 intron pairs from 28 artiodactyl/rodent genes, and 93 intron pairs from 35 mouse/rat genes. In the present work, multiple introns in a gene were individually analyzed. We also obtained 3' transcribed non-coding sequence pairs from 50 human/monkey (old world monkey) genes, which was to be used for the estimation of sequence diversity in both the coding and the non-coding sequences. For the analysis of insertion and deletion frequencies by the three-species comparison, we extracted genic non-coding sequences of 10 homologous genes from human/hominoids/monkeys totaling about 6 knt. The GenBank locus names of our data sets are available upon request by e-mail to: ogata@kuicr.kyoto-u.ac.jp.
2.2. Estimation of mutageneses
In order to count the accumulated natural mutageneses, i.e., insertions, deletions, and nucleotide substitutions, multiple alignments of intron sequences, flanking non-coding sequences, and translated coding sequences were produced by the alignment program CLUSTAL-V [10]. For the analysis of gaps in the alignments, we employed the three-species strategy taken by Gu and Li [8], which enabled us to separately count the deletion and insertion events in DNA sequences after the separation of the closest species pair.
The mutation rate in coding sequences was measured in terms of the percent difference of third codon positions of aligned sequences, i.e., the synonymous difference frequency (SDF) [11]. In order to estimate the mutation rate in non-coding sequences, we calculated the percent difference, K, of aligned 3' transcribed non-coding sequences eliminating gaps in the alignment.
2.3. Elimination of Repetitive DNA
There is a large number of known
repeated sequences dispersed in mammalian genomes. Repetitive sequences
change the lengths of non-coding sequences and the genome size. In order
to estimate the effect on our data set, we compared the intron sequences
to REPBASE in the NCBI Data repository (1995), a large compilation of repetitive
sequences, by the similarity search program BLASTN [12]. We used all the
mammalian related repetitive sequences available from REPBASE. The threshold
score for similarity was set to S >= 200, which resulted in the detection
of a number of high-scoring segment pairs including the completely matching
pair of 40 nt and the least matching (54%) pair of 259 nt. Thereafter,
overlapping repetitive segments were merged and the lengths of continuous
stretches of repetitive DNA were estimated.
3. Results
3.1. Insertion and deletion frequencies
To estimate the insertion/deletion frequencies between human and hominoids, three-way multiple alignments of the genic non-coding sequences were made for 10 homologous genes from human, hominoids, and old world monkeys. The produced alignments of the total of more than 6 knt contained 93.7% matches, 3.8% mismatches, and 2.5% gaps between human and hominoid sequences. The alignments were insensitive to the scoring parameters of CLUSTAL-V and were considered highly reliable. An insertion or a deletion was assigned to a gap in the human or hominoid sequence using the monkey sequence as a reference.
The analysis showed a significant difference between the numbers of insertions and deletions. In all 24 gaps in the alignments, 21 were deletions and only 3 were insertions, which was consistent with the previous observation of the higher frequency of deletions than insertions among human processed pseudogenes [8]. The two-tailed binomial test gave P < 0.0003 under the null hypothesis of equal frequency of deletions and insertions. The maximum length of a gap observed in the alignment was a 16 nt deletion. Therefore, the observed tendency does not seem to be due to transposable elements like SINEs and LINEs, which usually are considerably longer. The higher frequency of short deletions than short insertions in genic non-coding sequences may thus be considered a factor to decrease the size of genomic DNAs and introns.
3.2. Intron size differences
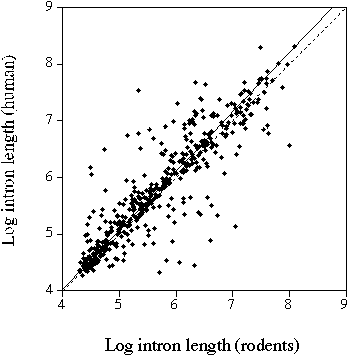
The size of human introns is plotted
against the size of rodent homologues in Figure 1. As expected, the intron
size was well correlated between human and rodent homologues with the correlation
coefficient of R = 0.89 (P < 0.005). The deviation of
the regression line [13] from the diagonal line indicates the average difference
of intron sizes between human and rodents. The actual values of the average
percent difference of intron sizes are shown in Table 1 for the four organism
pairs analyzed. A human intron was, on the average of 457 samples, 22.5%
longer than the corresponding rodent intron. Although the standard deviation
(SD) appeared large, the difference was highly significant (P <
0.005). The interspecies comparison of 76 samples between human and artiodactyls
exhibited, on the average, 18.8% longer introns for human (P <
0.005). The comparison of 76 samples between artiodactyls and rodents showed,
on the average, 33.2% longer introns for artiodactyls (P < 0.025).
However, the comparison of 93 samples between mouse and rat did not show
any significant difference.
Figure 1. The intron length from
human is plotted in the natural logarithmic scale against the corresponding
intron length from rodents. The correlation coefficient is: R =
0.89. The first principal component axis (solid line) and the diagonal
line (dotted line) are shown.
One may think that the observed differences
of intron sizes can be attributed to the amplification of repeated DNA
sequences. We removed known repeated sequences according to the procedure
described in the Materials and methods section, and re-calculated the average
intron size differences (Table 1). The differences between human and rodents,
and between artiodactyls and rodents decreased to 14.7% and 30.3%, respectively,
but both values remained significant (P < 0.005). However, the
difference between human and artiodactyls became insignificant when it
decreased from 18.8% to 4.2%. The difference between the closest pair of
mouse and rat also decreased from 3.4% to 2.5%, but it now appeared more
significant (P < 0.05) due to the smaller standard deviation.
Table 1. The average percent
difference of intron sizes between two organisms.
|
|
|
||||||
| Organism pair |
|
|
|
|
|
|
|
| human > rodents |
|
|
|
|
|
|
|
| human >artiodactyls |
|
|
|
|
|
|
|
| artiodactyls > rodents |
|
|
|
|
|
|
|
| mouse = rat |
|
|
|
|
|
|
|
* The size difference is defined
with the shorter sequence as a reference.
In addition to the average percent
difference of Table 1, the distribution profiles of intron size differences
are shown in Figure 2, which reveals more detailed features. In all 457
comparisons 68.0% of human introns were longer than corresponding rodent
introns (Fig. 2(a)). When the repeated sequences were removed, 64.3% of
human introns were still longer than rodent introns. The artiodactyl/rodent
comparison showed a similar tendency. In all 76 comparisons, 73.7% of artiodactyl
introns were longer than corresponding rodent introns (Fig. 2(c)). This
value also remained at a similar level after the removal of repeated sequences.
All these differences were significant according to the Wilcoxon signed
rank test (P < 0.005), which coincided with the standard t-test
for the length difference shown in Table 1. For human/artiodactyl comparisons,
57.1% of human introns were longer than artiodactyl introns (Fig. 2(b)).
In this case, however, the observed tendency disappeared after the removal
of repeated sequences. The Wilcoxon signed rank test gave no significance
for this organism pair. It is interesting to notice that the shape of either
half of each distribution profile in Figure 2 is similar to the known distribution
function found in pseudogenes [8], fk
~
k-b, where k is the insertion
size or the deletion size and b is a constant.
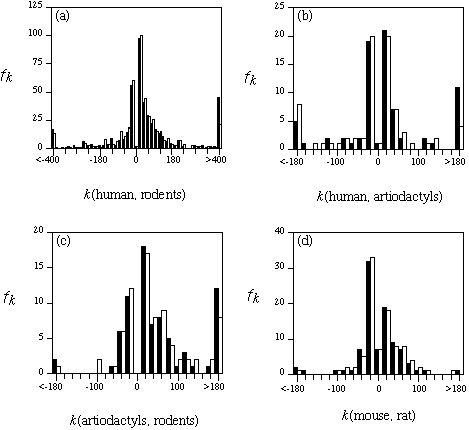
Figure 2. The frequency fk
of observing k nucleotide differences between corresponding
introns from two organisms. The size difference k(organism1, organism2)
is calculated by the intron size of organism1 minus the intron size of
organism2. The filled bar shows the frequency in the raw data set, and
the open bar shows the frequency after the removal of repetitive DNAs.
Each bar represents the frequency within a given range of k, except
the bars in the middle that indicate the frequencies for the single value
of k = 0 (no difference).
3.3. Relationship between the intron size difference and the mutation rate
The SDF (synonymous difference frequency) value of coding sequences can be considered a measure of the mutation rate that varies with chromosomal positions, because most of the silent substitutions in mammalian genes appear to be selectively neutral [14-16]. However, since SDF is calculated from the alignment of coding sequences, the relation between SDF and the sequence difference, K, in non-coding sequences has to be established before using SDF as a measure of the mutation rate of non-coding sequences as well.
The alignments of 50 sequence pairs between human and old world monkeys were constructed for the analysis of coding and 3' untranslated regions. There was a significant correlation between the sequence difference of this regions, K, and the synonymous difference, SDF. The correlation coefficient was R = 0.46 and the probability of observing this value by chance was P < 0.005. Thus, we conclude that the mutation rate is fairly uniform, at least, in a genic sequence extending both coding and non-coding regions. It is now possible to use SDF of coding-sequences as an appropriate qualitative measure of the point mutation rate of adjacent introns and to examine any relationships between the intron size difference and the mutation rate.
When we divided the largest data
set of human and rodent introns into two by the mean value of SDF, a positive
correlation was observed between the size difference and the SDF value
as shown in Table 2. The intron size difference was 29.7% for the higher
SDF group and 15.6% for the lower SDF group, and the latter was significantly
smaller than the former (P < 0.05). This means that a faster
evolving intron in terms of point mutations shows a larger size difference
than a slower intron. This tendency remained after the removal of repetitive
sequences, although the statistical significance level was decreased (Table
2).
Table 2. Correlation of the
percent difference of intron sizes with the synonymous difference frequency
and the isochore family.
|
|
|
|||
|
|
|
|
|
|
|
|
|
|
|
|
|
|
|
|
|
|
|
|
|
|
||
|
|
|
|
|
|
|
|
|
|
||
3.4. Relationship between the intron size difference and the isochore family
It is known that long stretches (>>200
knt) of GC- or AT-rich sequences, or isochores, constitute heterogeneous
genomes of warm-blooded vertebrates and that they are related to R and
G chromosomal bands [17,18]. The GC-level of the isochore family where
a gene is located is well correlated to the GC-level of the third codon
position. It has been argued that there is a correlation between the frequency
of recombinations, which can result in the expansion and shrinkage of repeat
elements, and the GC-level of isochore families [19]. In order to check
if there is any correlation between the intron size difference and the
isochore family, we used the following assignment [18]. If the GC-level
of third codon positions was less than 57%, L (L1+L2) isochore family was
assigned to the sequence, otherwise H (H1+H2+H3) isochore family was assigned.
As shown in Table 2, for human and rodents the intron size difference was
23.0% in H family and 20.7% in L family (Table 2). When the H family was
further divided at the GC-level of 75%, the size difference was 22.0% for
H1+H2 family and 23.6% for H3 family. Thus, no correlation was observed
between the intron size difference and the isochore family (GC-content)
of the genes.
4. Discussion
The detailed analysis on the gaps in the alignments of genic non-coding sequences revealed the higher frequency of deletions than insertions. The imbalance between these two mutagenic events can be a driving force that decreases the genome size and also the intron size. We observed gaps (insertions and deletions) of fairly small sizes in non-coding sequences, the longest one being a 16 nt deletion, which is consistent with the previous observations of short deletions [20-22]. The distribution of gap lengths found in the alignment of human/rodent introns also indicates a higher frequency of smaller gaps (data not shown). As mentioned the shape of the distribution in Figure 2 was similar to the deletion size distribution of pseudogenes [8], again suggesting a mechanism of accumulating small deletions. It has long been known that insertions and deletions often cause a lethal frame-shift at the stage of meiosis [23]. Since the generation times are different for different organisms, the bias between deletions and insertions may affect differently on different organisms; namely, organisms with shorter life cycles should be affected more and the size of their introns should become shorter.
This was in fact the case in our analysis of homologous introns among three organism groups from different mammalian orders: human, artiodactyls, and rodents. The intron size was the longest for human and the shortest for rodents. The intron size differences observed for human/rodents and artiodactyls/rodents, which remained significant even after the removal of the repetitive sequences, seem to support the relationship to the generation time of these organisms.
The observation of larger intron size differences at chromosomal locus suffering higher rates of point mutations implies a correlation between deletions and point mutations. This may be attributed to the conditions that surround DNA, such as mutagenic agents and the DNA repairing system. Different local chromatin structures can induce the attack of different types of DNA damaging agents [24]. The condensation and decondensation of chromatin structures, which is accompanied by inactivation and activation of a gene, are related to the sensitivity to a nuclease involved in the repairing system [25,26]. Together with the previous report of a positive correlation between the rate of insertion/deletion events and the amino acid substitution rate [27], our observation supports the existence of molecular mechanisms that cause point mutations and insertions/deletions in a correlated manner.
Duret et al. [6] found that the intron length was on average 1.6 times longer in GC-poor isochores than in GC-rich isochores. They argued that a major mechanism responsible for the phenomenon was a higher recombination frequency in GC-rich isochores [19], which could result in excisions and/or insertions of DNA fragments. We did not, however, observe any significant correlation between the interspecies intron size difference and the isochore family (Table 2).
The C-value paradox, i.e., the lack of correlation between the genome size and the organismic complexity, suggests the existence of molecular mechanisms that increase the genome size, e.g., amplifications of repeat elements, irrespective of mechanisms of increasing complexity, e.g., functional gene duplications. In contrast, our observation suggests the existence of small size deletions that decrease the genome size. Although our analysis is based only on sequences in genic regions, it is not unreasonable to think that the same molecular mechanism is working on the entire genome. A genome may be viewed as a dynamic entity under competing mutation pressures for increasing and decreasing the genome size. It appears that mutation events that involve long stretches of DNAs are favored for increasing the genome size, i.e., duplications and insertions, while the mutation events that involve short pieces of DNAs are favored for decreasing the genome size, i.e., small size deletions. Thus, different organisms, as well as different regions of a genome of an organism, may be under different balance conditions for these two types of mutations.
Non-genic non-coding regions may
be under little selection pressures and both types of mutations can be
accepted, resulting in the tendency of large-scale changes. Translated
coding regions are under high selection pressures and either type of mutations
cannot be accepted, resulting in little changes in the length. In contrast,
genic non-coding regions including introns may be under little selection
pressures for small-scale mutations but under higher selective pressures
for large-scale mutations. Namely, introns are selectively neutral to small-scale
mutations, which turned out to be favored for decreasing the genome size.
The distribution profile of intron lengths, a small peak around ~90 nt
and a trailing tail of long introns, is also consistent with the argument
of frequent deletions of small segments and occasional expansions and insertions
of long segments. As shown in this paper, introns seem best suited to detecting
the molecular event of small-scale mutations.
Acknowledgements: This work
was supported in part by the Grant-in-Aid for Scientific Research on the
Priority Area 'Genome Informatics' from the Ministry of Education, Science,
Sports, and Culture of Japan. The computation time was provided by the
Supercomputer Laboratory, Institute for Chemical Research, Kyoto University.
References
[1] Hawkins, J.D. (1988) Nucleic Acids Res. 16, 9893-9908.
[2] Smith, M.W. (1988) J. Mol. Evol. 27, 45-55.
[3] Engelbrecht, J., Knudsen, S. and Brunak, S. (1992) J. Mol. Biol. 227, 108-113.
[4] Dibb, N.J. (1993) FEBS Lett. 325, 135-139.
[5] Long, M., Rosenberg, C. and Gilbert, W. (1995) Proc. Natl. Acad. Sci. USA 92, 12495-12499.
[6] Duret, L., Mouchiroud, D. and Gautier, C. (1995) J. Mol. Evol. 40, 308-317.
[7] Hughes, A.L. and Hughes, M.K. (1995) Nature 377, 391.
[8] Gu, X. and Li, W.-H. (1995) J. Mol. Evol. 40, 464-473.
[9] Duret, L., Mouchiroud, D. and Gouy, M. (1994) Nucleic Acids Res. 22, 2360-2365.
[10] Higgins, D.G. (1994) Methods Mol. Biol. 25, 307-318.
[11] Mouchiroud, D. and Gautier, C. (1990) J. Mol. Evol. 31, 81-91.
[12] Altschul, S.F., Gish, W., Miller, W., Myers, E.W. and Lipman, D.J. (1990) J. Mol. Biol. 215, 403-410.
[13] D*fOnofrio, G., Mouchiroud, D., Aissani, B., Gautier, C. and Bernardi, G. (1991) J. Mol. Biol. 32, 504-510.
[14] Wolfe, K.H., Sharp, P.M. and Li, W.-H. (1989) Nature 337, 283-285.
[15] Bulmer, M., Wolfe, K.H. and Sharp, P.M. (1991) Proc. Natl. Acad. Sci. USA 88, 5974-5978.
[16] Wolfe, K.H. and Sharp, P.M. (1993) J. Mol. Evol. 37, 441-456.
[17] Bernardi, G., Olofsson, B., Filipski, J., Zerial, M., Salinas, J., Cuny, G., Meunier-Rotival, M. and Rodier, F. (1985) Science 228, 953-958.
[18] Mouchiroud, D., D*fOnofrio, G., Aissani, B., Macaya, G., Gautier, C. and Bernardi, G. (1991) Gene 100, 181-187.
[19] Eyre-Walker, A. (1993) Proc. Roy. Soc. Lond. B. Biol. Sci. 252, 237-243.
[20] Efstratiadis, A., Posakony, J.W., Maniatis, T., Lawn, R.M., O*fConnell, C., Spritz, R.A., DeRiel, J.K., Forget, B.G., Weissman, S.M., Slightom, J.L., Blechl, A.E., Smithies, O., Barelle, F.E., Shoulders, C.C. and Proudfoot, N.J. (1980) Cell 21, 653-668.
[21] Cann, R. and Wilson, A.C. (1983) Genetics 104, 699-711.
[22] Langley, C.H., Montgomery, E.A. and Quattlebaum, W.F. (1982) Proc. Natl. Acad. Sci. USA 79, 5631-5635.
[23] Muller, H.J. (1959) Progress in nuculear energy. ser. 6, vol. 2, pp. 146-160. Pergamon Press, New York
[24] Boulikas, T. (1992) J. Mol. Evol. 35, 156-180.
[25] Herbomel, P. (1990) New Biol. 2, 937-945.
[26] Mullenders, L.H., van Zeeland, A.A. and Natarajan, A.T. (1987) J. Cell Sci. Suppl. 6, 243-262.
[27] Gu, X. and Li, W.-H. (1992)
Mol. Phylogenet. Evol. 1, 211-214.